
داشبورد کسب و کار چیست؟
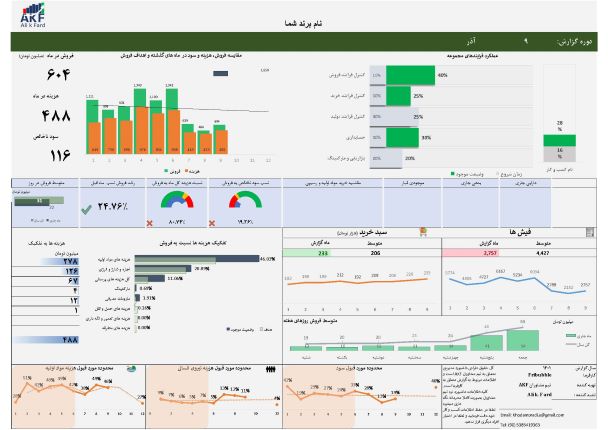
داشبورد کسب و کار که عموما به وضعیت مالی یک کسب وکار می پردازد; می تواند نتیجه اقداماتی که در ماه یا ماه های گذشته داشتید را بصورت کامل به شما نشان دهد. اکثر مشتریان و صاحبان کسب و کار که با آنها در ارتباط بودم، معتقد بودند که تمام زیر و بم کسب و کار خود را می شناسند و بر تمام جریانات آن اشراف دارند. اما پس از طراحی، اجرا و دیدن داشبورد کسب و کار خود توانستند فراتر از آنچه تصور می کردند از کسب و کار خود مطلع شوند. اجرای تصمیم های بسیار متمرکزتر و سازنده در جهت بهتر شدن کسب وکار یکی از مزایای مهم این ابزار است.
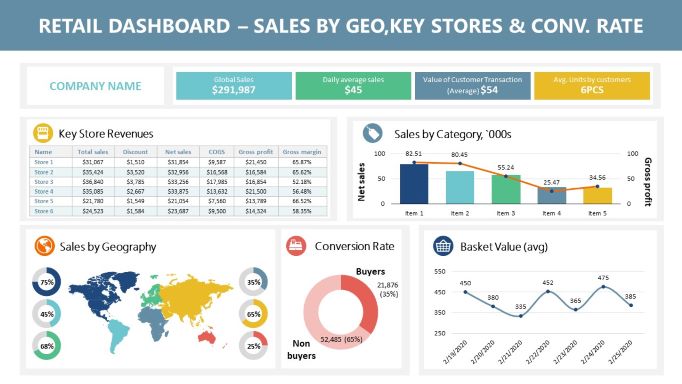
داشبوردهای کسب و کار با توجه به نیاز شما به شرح زیر است و می توانید با کیلک روی هرکدام توضیحات کامل آن را مطالعه نمایید:
داشبورد مالی ماهانه و سریع
این داشبورد اطلاعات کلی (مالی) کسب و کار شما را جمع آوری می کند و به شما در یک صفحه گزارش میدهد. مانند درآمد، هزینه های مواد اولیه، نیروی انسانی، محل، هزینه های سربار. این داشبورد بسیار خلاصه ولی کامل به شما نشان میدهد که در ماه گذشته اقدمات شما چطور در کسب و کار شما تاثیر داشته است. طراحی اینگونه داشبوردها بسیار حساس و حرفه ای باید باشد، زیرا در صورت عدم نمایش درست اطلاعات به نحوی که شما بتوانید تصمیم بگیرید می تواند شما را به اشتباه بیاندازد. بنابراین طراحی و اجرای این داشبورد را به حرفه ای ها بسپارید.

داشبورد کلی کسب و کار
این داشبورد معمولا اطلاعات چند ماه (بیشتر از 2 ماه) را با هم مقایسه می کند، شما حتی میتوانید اطلاعات ماه های گذشته را نیز جمع آوری کنید و با توجه به آن وضعیت کسب و کار خود را در ماه های گذشته با مورد بررسی قرار دهید.
همچنین با داشتن این داشبورد هر ماه با ورود اطلاعات در پایگاه داده علاوه بر دریافت داشبورد ماهانه می تواندی داشبورد کلی کسب و کار را نیز دریافت کنید.
یکی از مزایای داشبورد کلی کسب و کار این است که این داشبورد به داشبورد مالی ماهانه متصل است و نیازی نیست که دوباره اطلاعات خود را وارد کنید.

داشبورد کسب و کار اختصاصی
داشبورد کسب و کار اختصاصی، مانند داشبوردهای کسب و کار است. فرق آن در این است که این داشبورد کاملا مطابق با نیازهای شما طراحی شده و شما محیط کاملا آسان و ساده اکسل آن را دریافت می کنید.
این داشبورد بصورتی طراحی می شود که تمام نیازهای خاص شما را نیز پوشش دهد و هر اطلاعاتی که مورد نیاز شما است به شما نمایش دهد و بصورت ماهانه مقایسه نماید.
فرق اصلی این داشبورد با داشبوردهای سریع در اینست که فرقی نمی کند که کسب و کار شما در چه حوزه ای باشد. این داشبورد مختص شما طراحی و اجرا خواهد شد.

داشبورد برندهای زنجیره ای
برندهایی که بیش از یک شعبه دارند می توانند با داشبوردهای کسب و کار شعب خود را با هم مقایسه کنند و نقاط قوت و ضعف هر یک را بهتر بشناسند. همچنین کل نسبت ها و شاخص های مالی برای کل برند ها بصورت کلی نیز در این داشبورد قابل مشاهده است.
مثلا مجموعه فروش کل شعب و فروش هر یک از شعب به تفکیک قابل مشاهده است. با می توانید هزینه های مواداولیه یا هزنیه های نیروی انسانی را در شعب بصورت یکجا مشاهده کنید و مجموع هزنیه هایی که پرداخت می کنید را نیز بصورت یکجا مشاهده نمایید.
نسبت های مالی بسیار مهم هستند و در این داشبوردها سعی می شود تا این شاخص ها نمایش داده شوند. این داشبوردها بصورت ماهانه و کلی است که به زودی به خدمات این مجموعه اضافه خواهد شد.

محرمانگی اطلاعات شما
مجموعه FardVisor یکی از مهمترین ماموریت های خود را حفظ و نگه داری اطلاعات ورودی میداند. به همین منظور اطلاعات شما به محض ورود در دیتابانک های آفلان ذخیره می شود و دسترسی به این اطلاعات از طریق بسترهای اینترنت عملا امکان پذیر نیست. الگوریتم های دیتابانک بصورتی طراحی شده که اطلاعات بصورت کاملا طبقه بندی شده و جداگانه برای هر کسب و کار ذخیره می شود و تایید گزارش های خروجی و داشبوردها بصورت دستی و توسط مدیریت سیستم انجام می شود.

 Persian
 English
 Turkish